Who am I
- My name is Zoë Farmer
- CU graduate with a BS in Applied Math and a CS Minor
- I'm a co-coordinator of the Boulder Python Meetup
- I'm a big fan of open source software
- http://www.dataleek.io
- @TheDataLeek, github.com/thedataleek, gitlab.com/thedataleek
- D3 Data Visualizer at Talus Analytics - http://www.talusanalytics.com
What's the problem?
- D3 doesn't have the popularity of Node, Angular, Python,
<insert popular framework here>, etc. - Documentation can be sparse.
- Most of us (myself included) learn from terse bl.ocks.org demos.
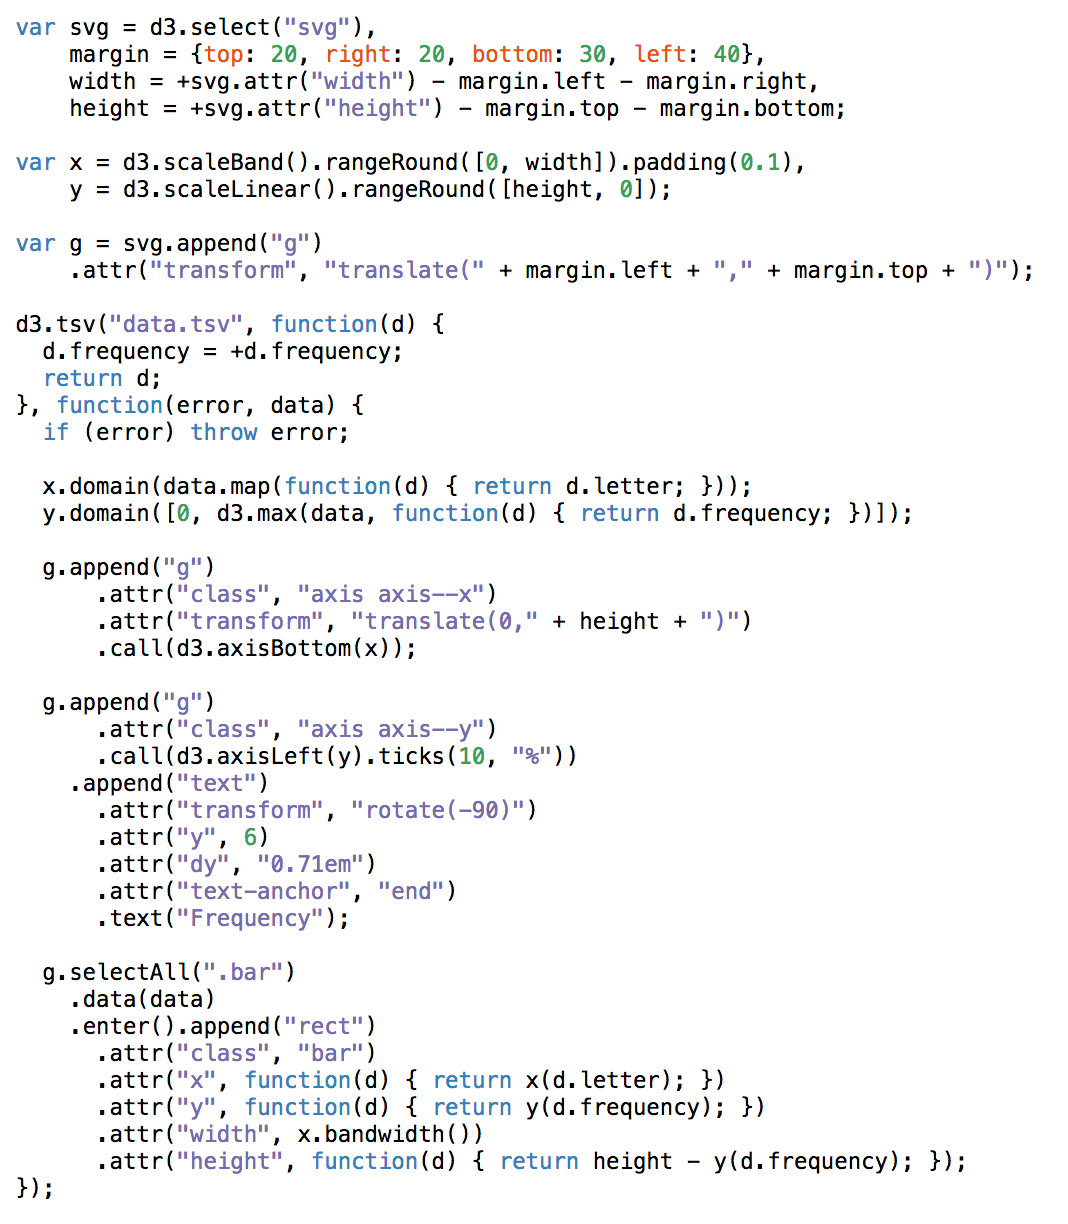
- Because of this, most D3 code tends to be write-only.
TL;DR -- D3 doesn't lend itself to reuse
Example - Scatterplot
So what can we do?
- Use classes
- Separate interaction from drawing
- Write with reuse in mind
Use Classes
class Chart {
    constructor(selector, params={}) {
        this.selector = selector;
        this.svg = d3.select(selector).append('svg');
        this.chart = this.svg.append('g').classed('chart', true);
        this.params = params;
    }
    newGroup(name) {
        if (this[name]) { this[name].remove() }
        this[name] = this.chart.append('g').classed(name, true);
    }
}
class Bar extends Chart { ... }
Separate Interaction
- Add invisible clickable elements
- You can make them bigger than your data
- Helpful for small elements
- Intuitive for user
- Don't need to worry (for the most part) about binding interactions to elements
Write with reuse in mind
- Most charts share 75% of their code with something you've probably already done.
- Use similar (preferably the same) data format for each method
- Write generic methods that you can reuse
class Bar extends Chart {
...
    drawBars(data) {
        this.newGroup('bars');
        this.bars
            .selectAll('rect')
            .data(data)
            .enter()
            .append('rect')
            .attr('transform', d => `translate(${this.xScale(d.key)})`)
            .attr('width', this.xScale.bandwidth())
            .attr('height', d => this.yScale(d.value))
            .attr('fill', d => d.properties.fill)....
    }
...
}
Takehome
- Use classes
- Separate interaction from drawing
- Write with reuse in mind
It's more work up front for each chart, but it will pay dividends.
In [ ]: