import numpy as np
import matplotlib.pyplot as plt
from mpl_toolkits.mplot3d import Axes3D

%matplotlib inline
fig = plt.figure(figsize=(8, 8))
ax = fig.add_subplot(111, projection='3d')
t = np.linspace(-8 * np.pi, 8 * np.pi, 100)
z = 10 * np.linspace(-2, 2, 100)
x = np.sin(t)
y = np.cos(t)
ax.plot(x, y, z)
ax.set_xlim(-5, 5)
ax.set_ylim(-5, 5)
plt.savefig('./img/spiral.png')
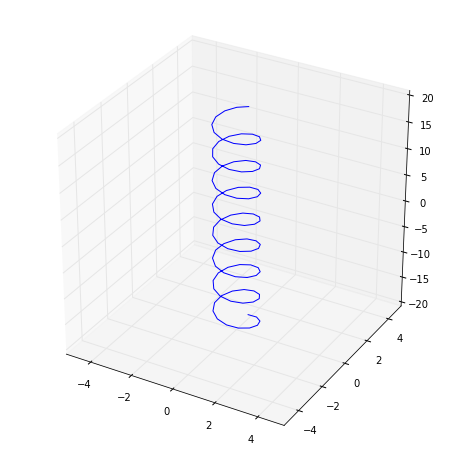
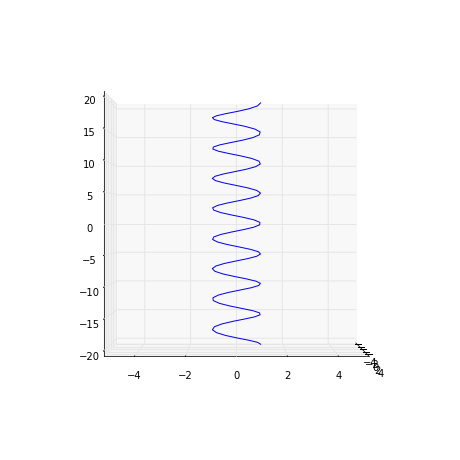
fig = plt.figure(figsize=(8, 8))
ax = fig.add_subplot(111, projection='3d')
t = np.linspace(-8 * np.pi, 8 * np.pi, 100)
z = 10 * np.linspace(-2, 2, 100)
x = np.sin(t)
y = np.cos(t)
ax.plot(x, y, z)
ax.set_xlim(-5, 5)
ax.set_ylim(-5, 5)
ax.view_init(0, 0)
plt.savefig('./img/spiral_front.png')
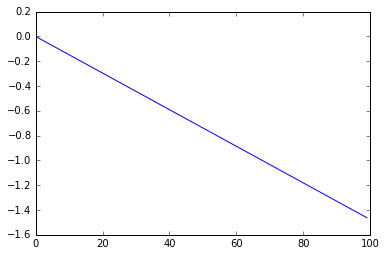
g = 1
def Su(n):
    return (1 / (4 * np.pi)**2) * ((-11 * n / 3) + (4 * n * g / 3))
x = np.arange(0, 100, 1)
plt.figure()
plt.plot(x, Su(x))
plt.show()