AirBnB Visualization
This is a followup visualization from my post on analyzing Boston’s AirBnB.
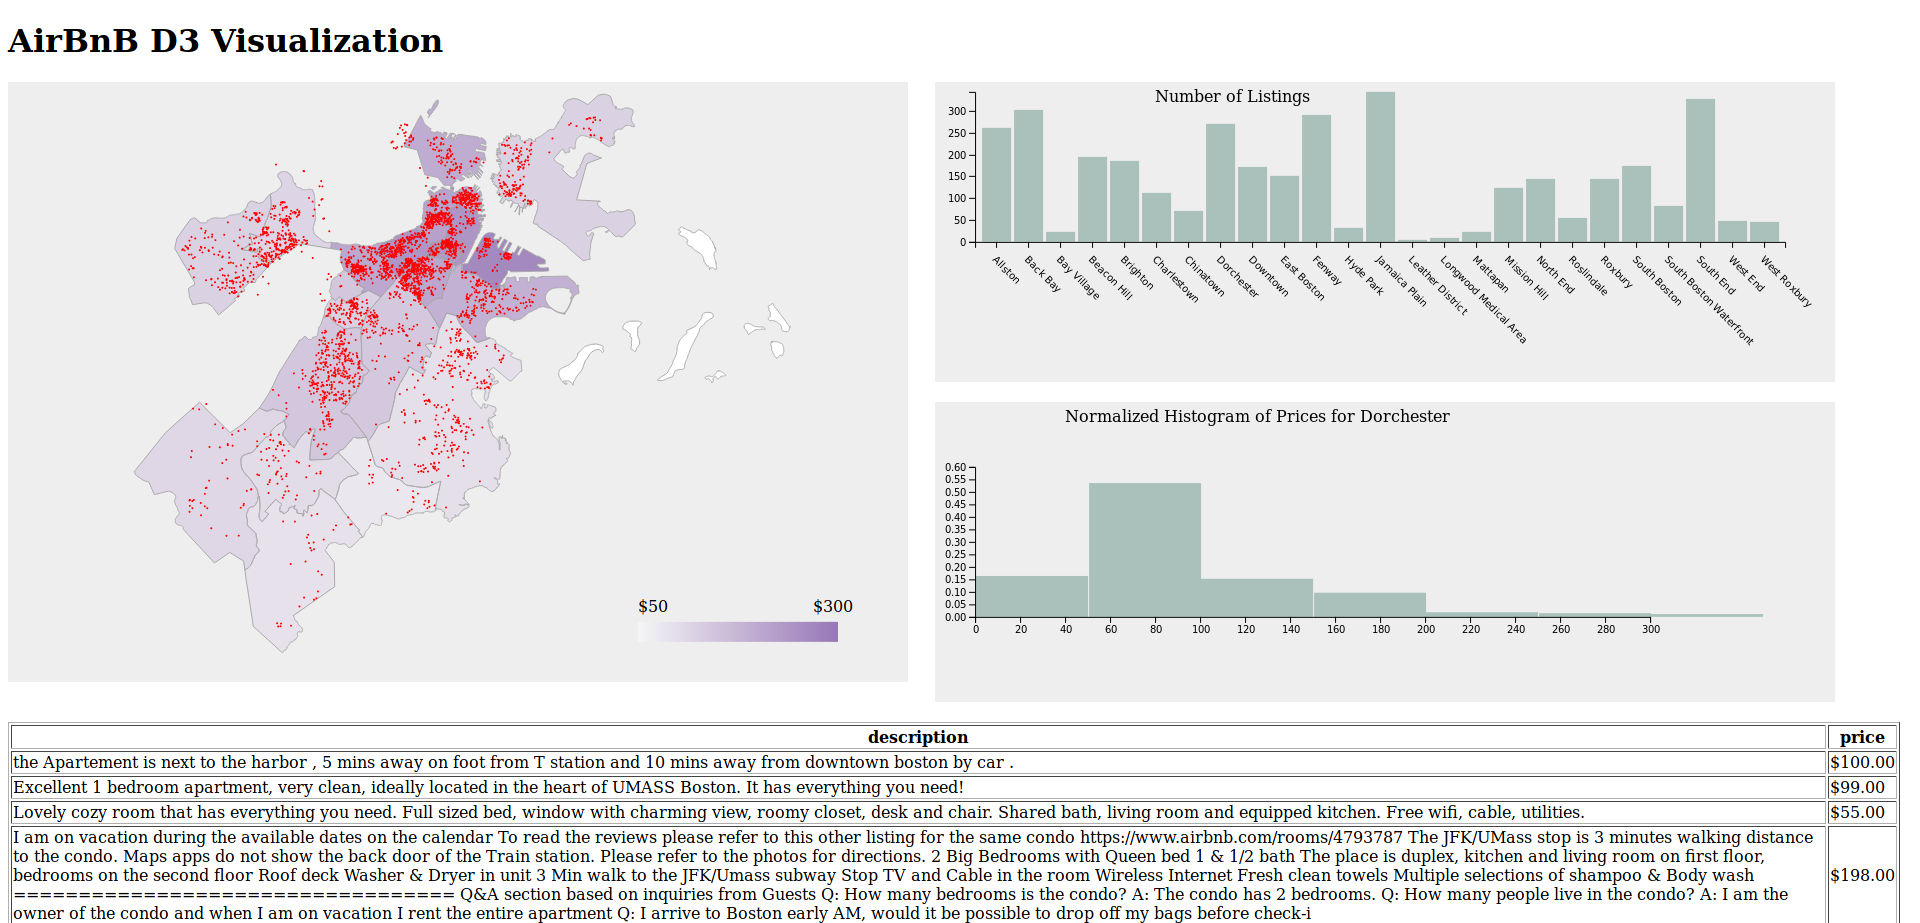
The below embedding is less than perfect, so please check it out fullscreen.
If it’s not rendering well for you, this is what you should see.
The Python to convert the raw data to geojson is super straightforward. (As an aside, I love how easy geojson is in D3)
We don’t save all the data, as that gives us a 16MB page download, so instead we only save the columns we need.
json_obj = []
column_keys = {key: i for i, key in enumerate(combined_data.columns)}
for row in combined_data.values:
    json_obj.append({
      "type": "Feature",
      "geometry": {
        "type": "Point",
        "coordinates": [
            row[column_keys['longitude']],
            row[column_keys['latitude']]
        ]
      },
      "properties": {
          str(key): str(row[column_keys[key]])
          for key in column_keys
          if ((not isinstance(key, tuple)) and
              (key.lower() in ['price', 'name', 'neighbourhood_cleansed', 'summary', 'description']))
      }
    })
with open('d3demo/airbnb.geojson', 'w') as fobj:
    fobj.write(json.dumps({
        'type': 'FeatureCollection',
        'features': json_obj
    }))