%pylab inline
Populating the interactive namespace from numpy and matplotlib
import numpy as np
from calculate_iterations import calculate_iterations
import matplotlib.pyplot as plt
max_iterations = 50
width = 1000
height = int(width * (2/3.5))
colors = np.zeros((height, width))
def add_color():
x0s = [((3.5 * px)/width) - 2.5 for px in range(width)]
y0s = [((2 * py)/height) - 1 for py in range(height)]
for px in range(width):
if px % 100 == 0:
print(px)
x0 = x0s[px]
for py in range(height):
y0 = y0s[py]
colors[py][px] = (255 * calculate_iterations(px, py, x0, y0, max_iterations))/max_iterations
add_color()
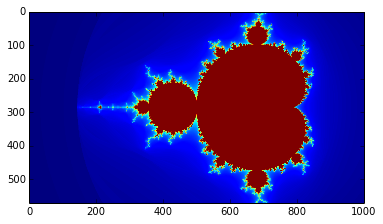
plt.imshow(colors)
plt.imsave('Mandelbrot.png', colors)
0
100


200


300


400


500


600


700


800


900